Accelerating Nature-Based Solutions for Wastewater Treatment Mitigate Climate, Water & Biodiversity Crises.
Accelerating Nature-Based Solutions for Wastewater Treatment Mitigate Climate, Water & Biodiversity Crises.
Background
Background
Measure, Report & Verify, All in One Place
Measure, Report & Verify, All in One Place
Embarking on a groundbreaking initiative, Rplace, an Israeli startup dedicated to climate solutions, sought to maximize the potential of natural wastewater treatment. They envisioned a first-of-its-kind MRV (measure, report & verify) platform to provide real-time, science-based data.
My role in designing this platform involved extensive exploration and research, encompassing user and market analyses, guiding the project toward a user-centric design.

Stakeholders
Stakeholders
Navigating Non-Technological Challenges
Navigating Non-Technological Challenges
During this project, I closely collaborated with a startup team consisting of experts in constructed wetlands management, carbon credits, and nature management. Leveraging their extensive knowledge, I designed the platform to meet user needs, despite the challenges posed by non-technological work methods.
During this project, I closely collaborated with a startup team consisting of experts in constructed wetlands management, carbon credits, and nature management. Leveraging their extensive knowledge, I designed the platform to meet user needs, despite the challenges posed by non-technological work methods.
Problem
Problem
Unraveling Complexity in Constructed Wetlands Management
Unraveling Complexity in Constructed Wetlands Management
Constructed wetlands, vital for wastewater treatment, involve intricate processes and collaboration
among various stakeholders.
The challenge lay in managing massive amounts of data generated through these live-green systems.
The MRV platform aimed to streamline this complexity and facilitate adherence to carbon certifications
and water reuse regulations.
Constructed wetlands, vital for wastewater treatment, involve intricate processes
and collaboration
among various stakeholders.
The challenge lay in managing massive amounts of data generated through these live-green systems.
The MRV platform aimed to streamline this complexity and facilitate adherence to carbon certifications
and water reuse regulations.
Market research
Market research
Pioneering Solutions in a Emerging Field
Pioneering Solutions in a
Emerging Field
To grasp the Rplace MRV platform's future workflow, I conducted a thorough market research on MRV platforms in the climate field. Focusing on the daily management and monitoring of wetlands data, I explored different dashboards to better understand hierarchy and user experience with information-packed screens.
To grasp the Rplace MRV platform's future workflow, I conducted a thorough market research on MRV platforms in the climate field. Focusing on the daily management and monitoring of wetlands data, I explored different dashboards to better understand hierarchy and user experience with information-packed screens.
The research led to several crucial conclusions:
The research led to several crucial conclusions:
MRV's organize data into sections and pages, necessitating expertise.
Data is presented in graphs, tables, and maps, requiring field-specific knowledge.
MRV's focus on information gathering, lacking daily management tools.
Daily use often involves other systems, hindering holistic management.
MRV's organize data into sections and pages, necessitating expertise.
Data is presented in graphs, tables, and maps, requiring field-specific knowledge.
MRV's focus on information gathering, lacking daily management tools.
Daily use often involves other systems, hindering holistic management.
User analysis
User analysis
Understanding Stakeholder Needs
Understanding Stakeholder Needs
Despite the initial brief from the startup founders, I conducted interviews with experts across various stages of the process. These discussions allowed me to comprehend daily workflows and needs, exploring current challenges and nuanced overlaps in processes.
Despite the initial brief from the startup founders, I conducted interviews with experts across various stages of the process. These discussions allowed me to comprehend daily workflows and needs, exploring current challenges and nuanced overlaps in processes.
The findings highlighted several important issues:
The findings highlighted several important issues:
No smart management systems; some use spreadsheets and analog systems.
Lack of integration in current tools.
Varying frequencies of processes, prone to forgetfulness.
Diverse user and project data requirements.
Initial low usage due to complexity; requires user-friendly design.
Users need access to data and tracking outside work hours.
This process resulted in a few user personas; we chose to focus on only one persona.
This process resulted in a few user personas; we chose to focus on only one persona.
Benny Bay
Ecological expert and a man of data
50/ Male
User Traits
Environmental Commitment
Adaptability Advocate
Socioeconomic status
Top-middle-class
Marital status
Married
Occupation
Marin biologist
Location
Hamburg, Germany
Committed to environmental quality, Benny oversees wastewater facility challenges using an analog system. He navigates limitations in data input, quantitative assessments, and data sharing preferences, advocating for an adaptive system.
Pain Points
Limited permission impedes active participation in data input.
Absence of quantitative assessments hampers material use evaluation.
Dashboards' structure impedes seamless regulator submissions and data sharing.
Advocates for an adaptive system catering to users' specific needs.
Design process
Design process
Crafting a Seamless Experience
Crafting a Seamless Experience
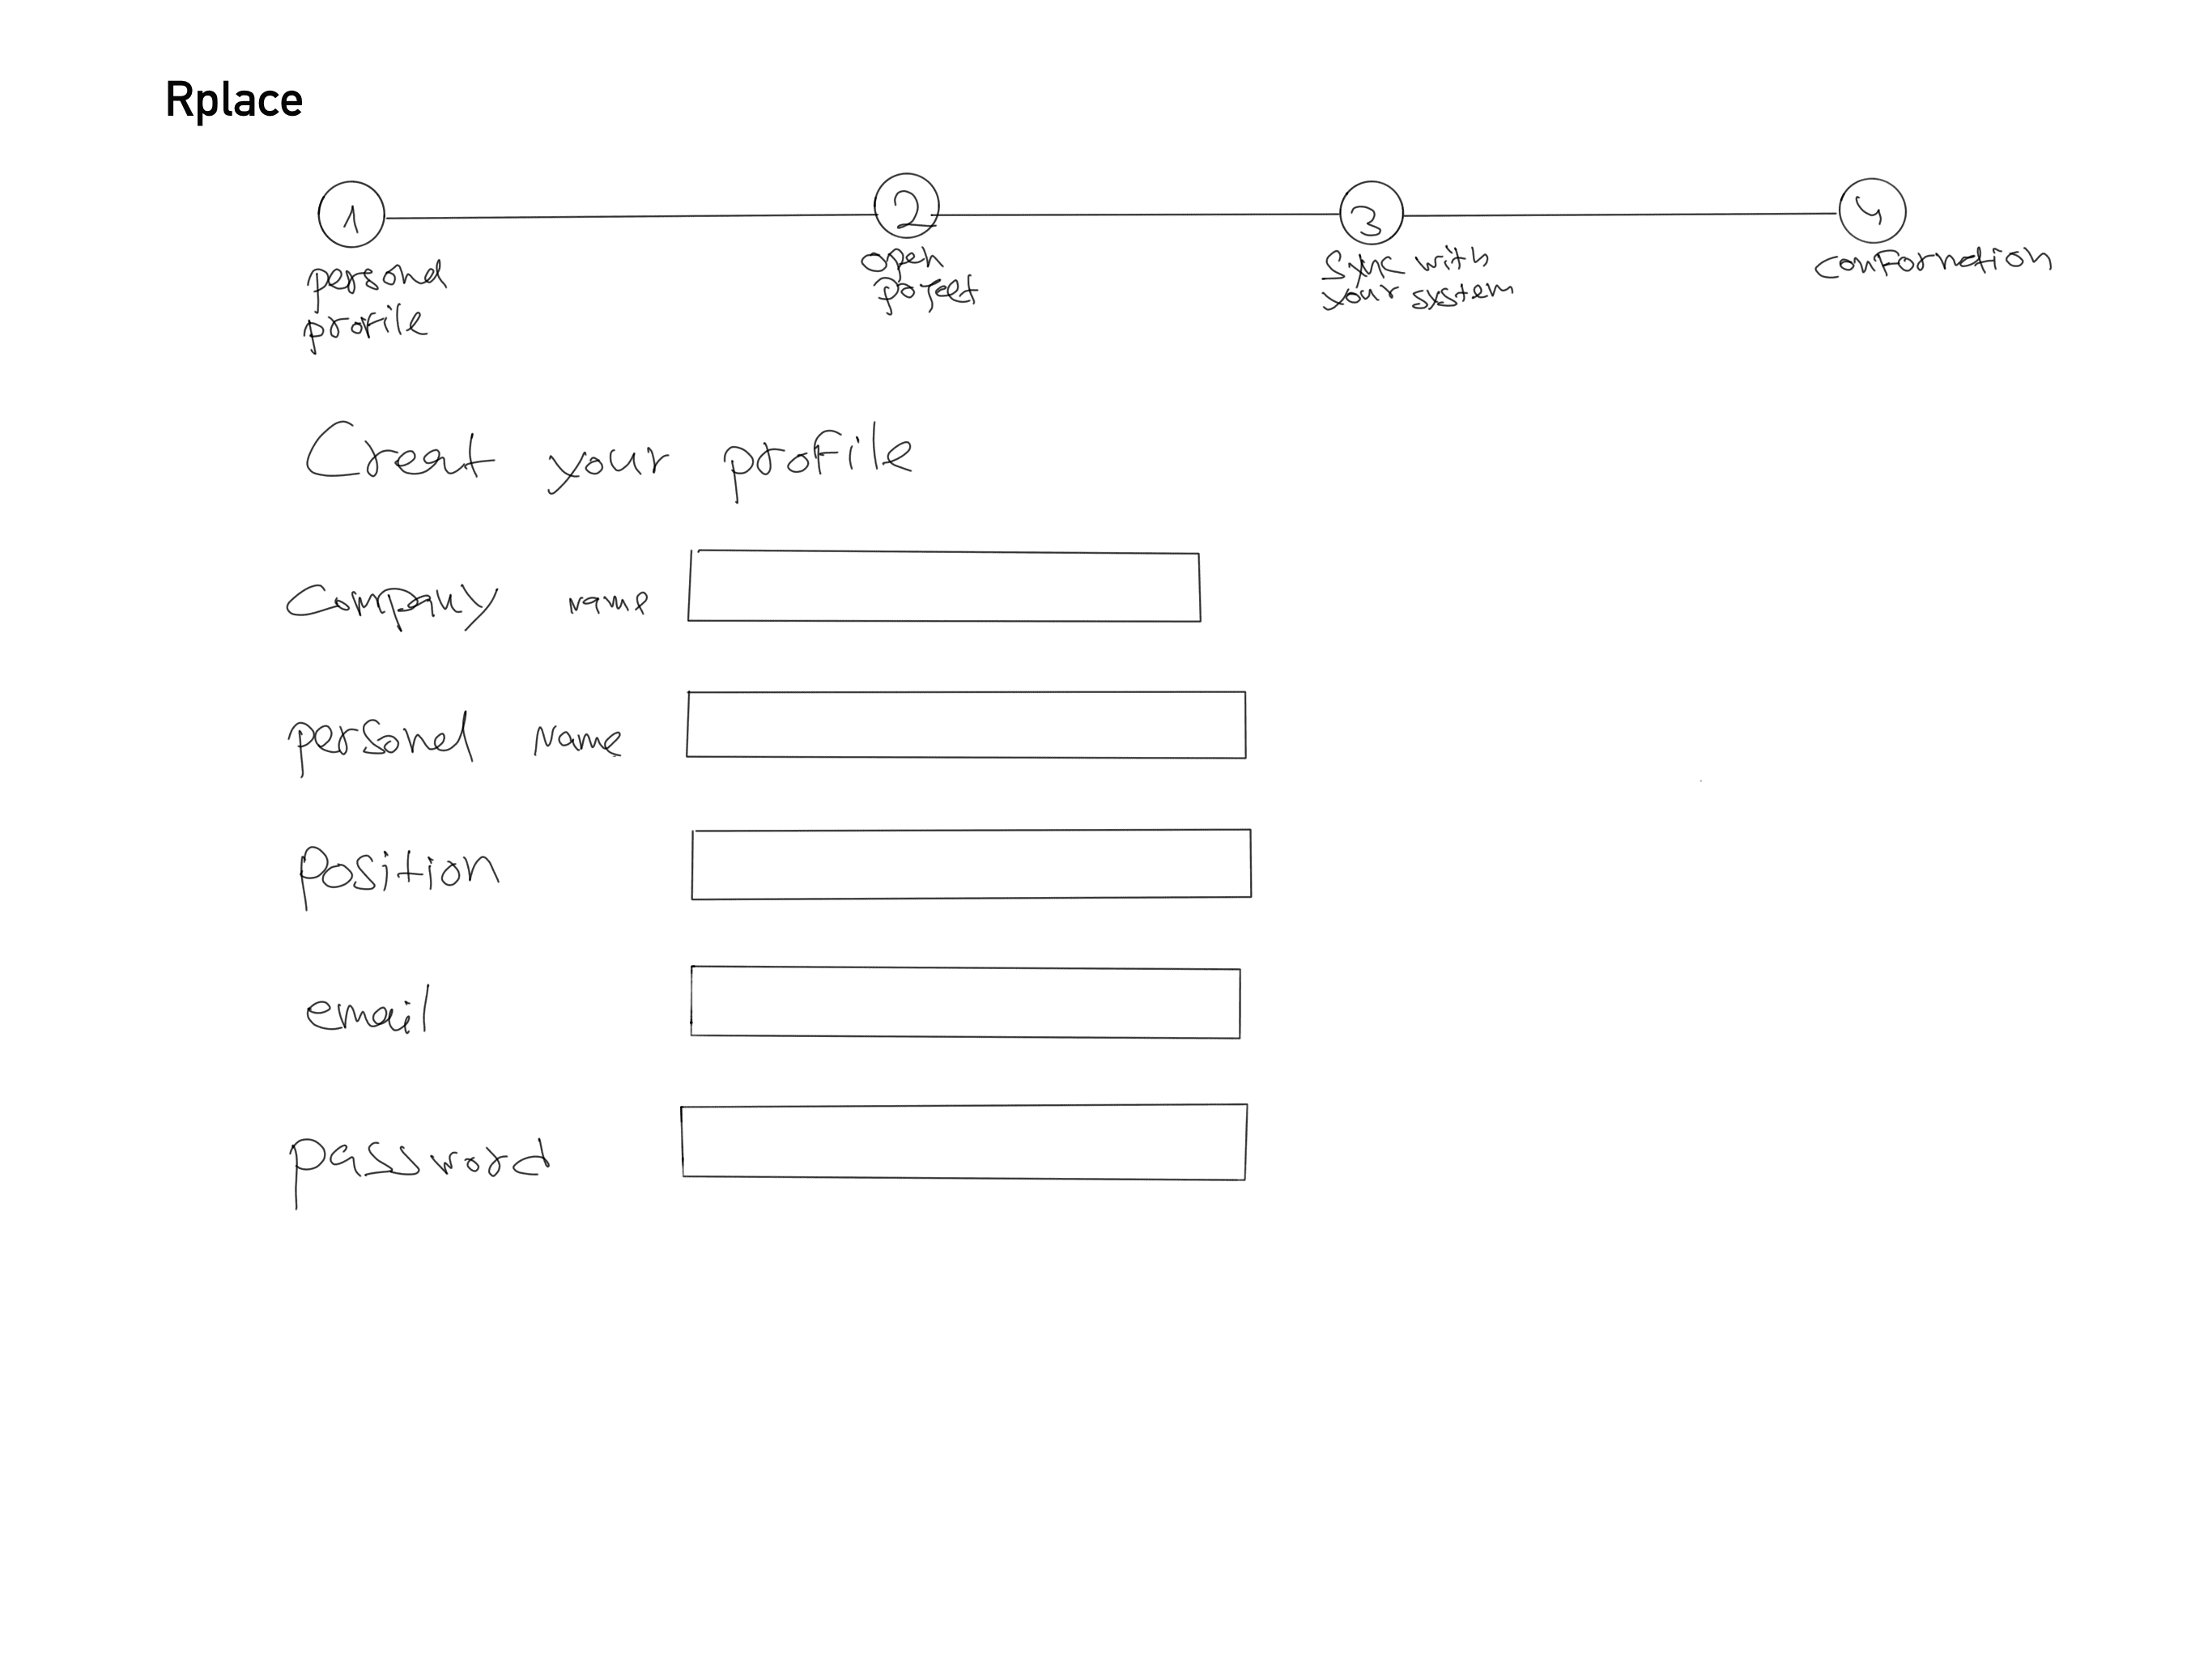
Structured user flows were essential to ensure ease of use and alignment with user needs.
Through sketches, wireframes, and continuous iterations, the design evolved to meet the demands of the stakeholders.
Structured user flows were essential to ensure ease of use and alignment with user needs.
Through sketches, wireframes, and continuous iterations, the design evolved to meet the demands of the stakeholders.
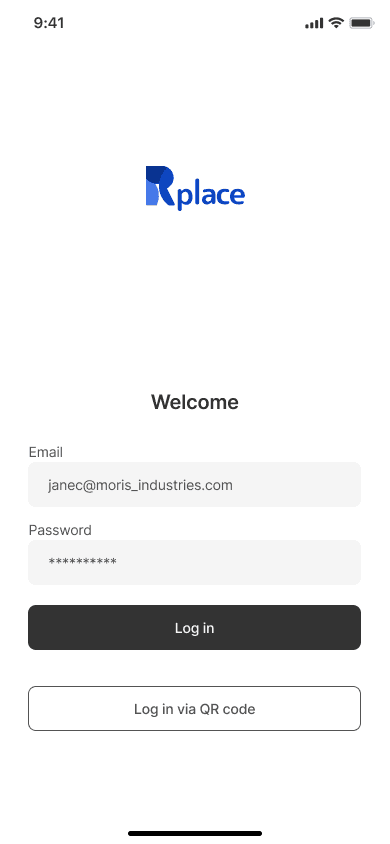
Log in / Sign up
Onboarding
User profile
New project
Integration
Conformation
Dahsboard
Live updates
Indicators
Cameras
Alerts
Forecast
Add data
Add alert
Add forecast
Add lab tests
Add photos
Add documents
Reports
Refine datasheet
Add data sheet
Export report
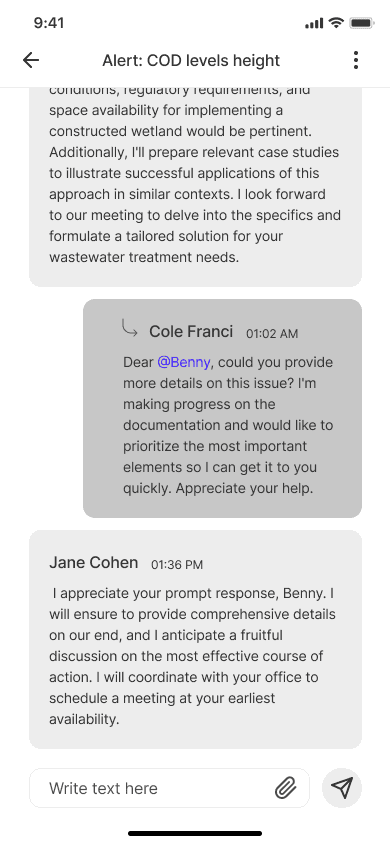
Communication
New message
All
Pinned
Groups
Mentions
Project profile
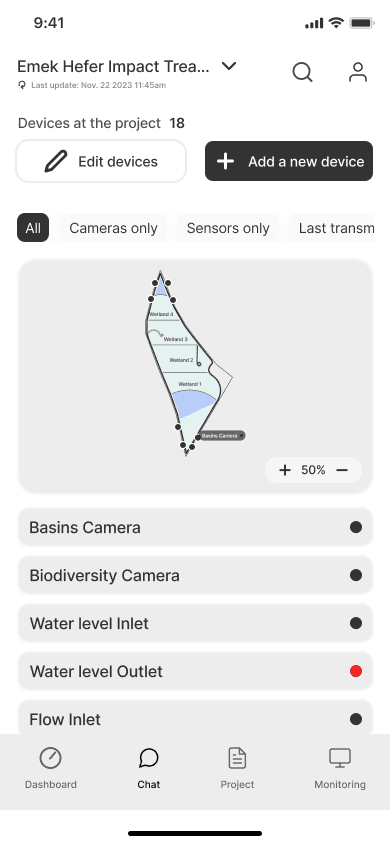
Monitor
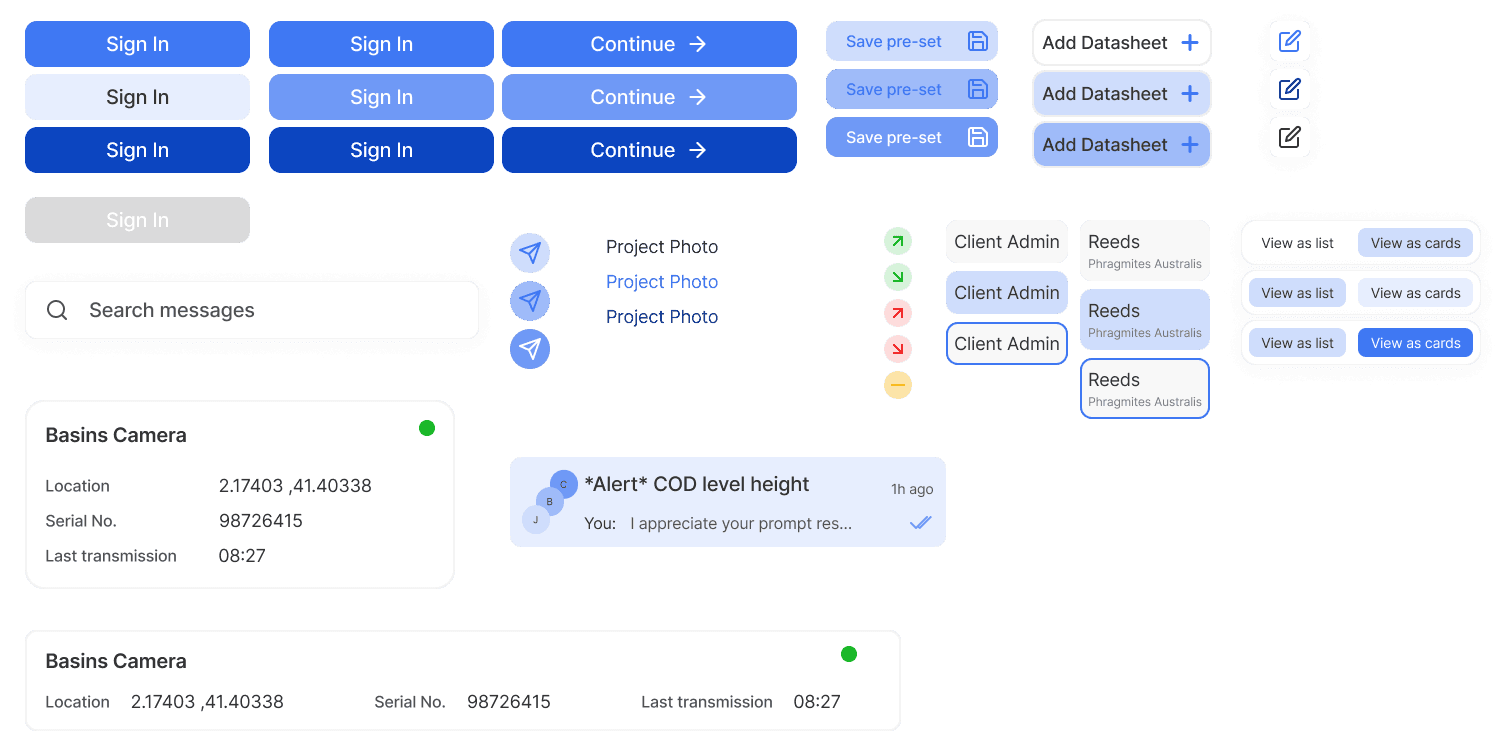
View as list
View as cards
Edit devices
Add new device
User profile
User details
Projects member

Low fidelity sketches
Low fidelity sketches


Solution
Solution
Navigating the Dashboard and Beyond
Navigating the Dashboard and Beyond
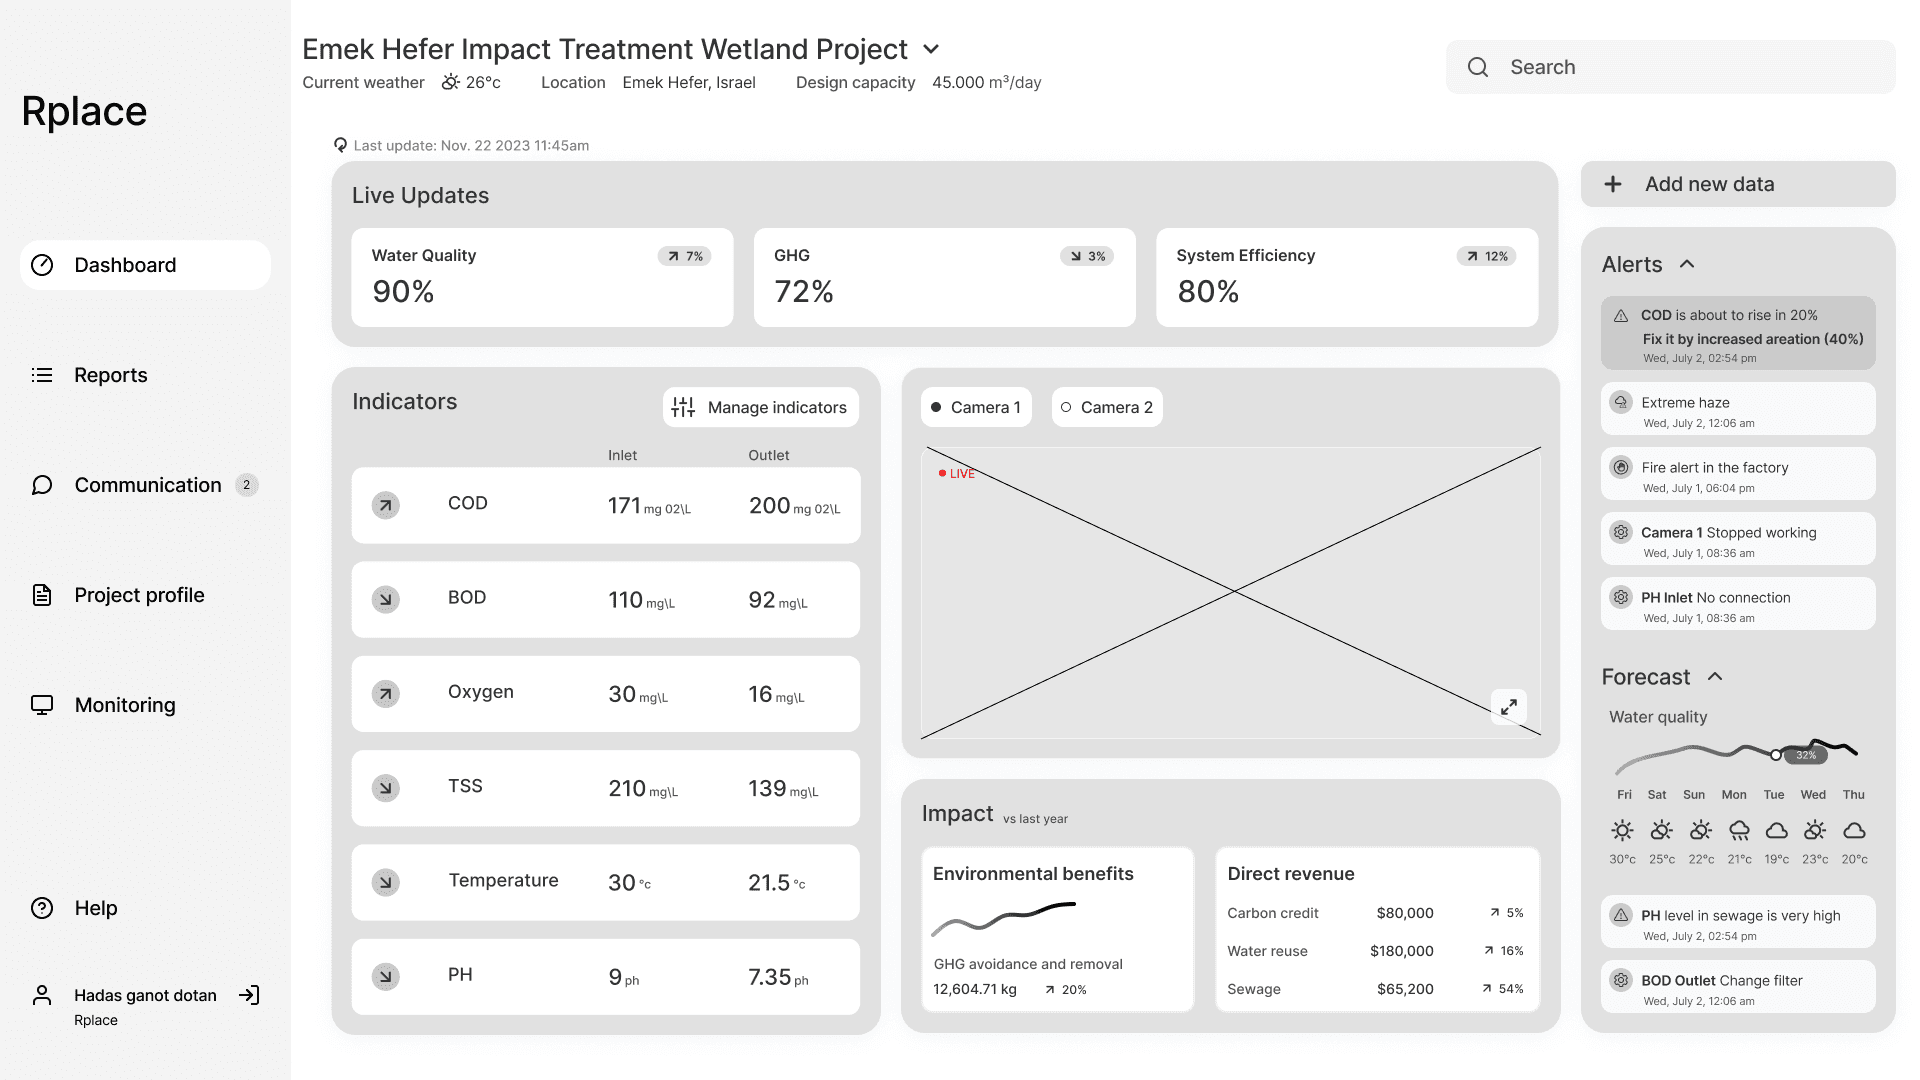
Dashboard
Dashboard
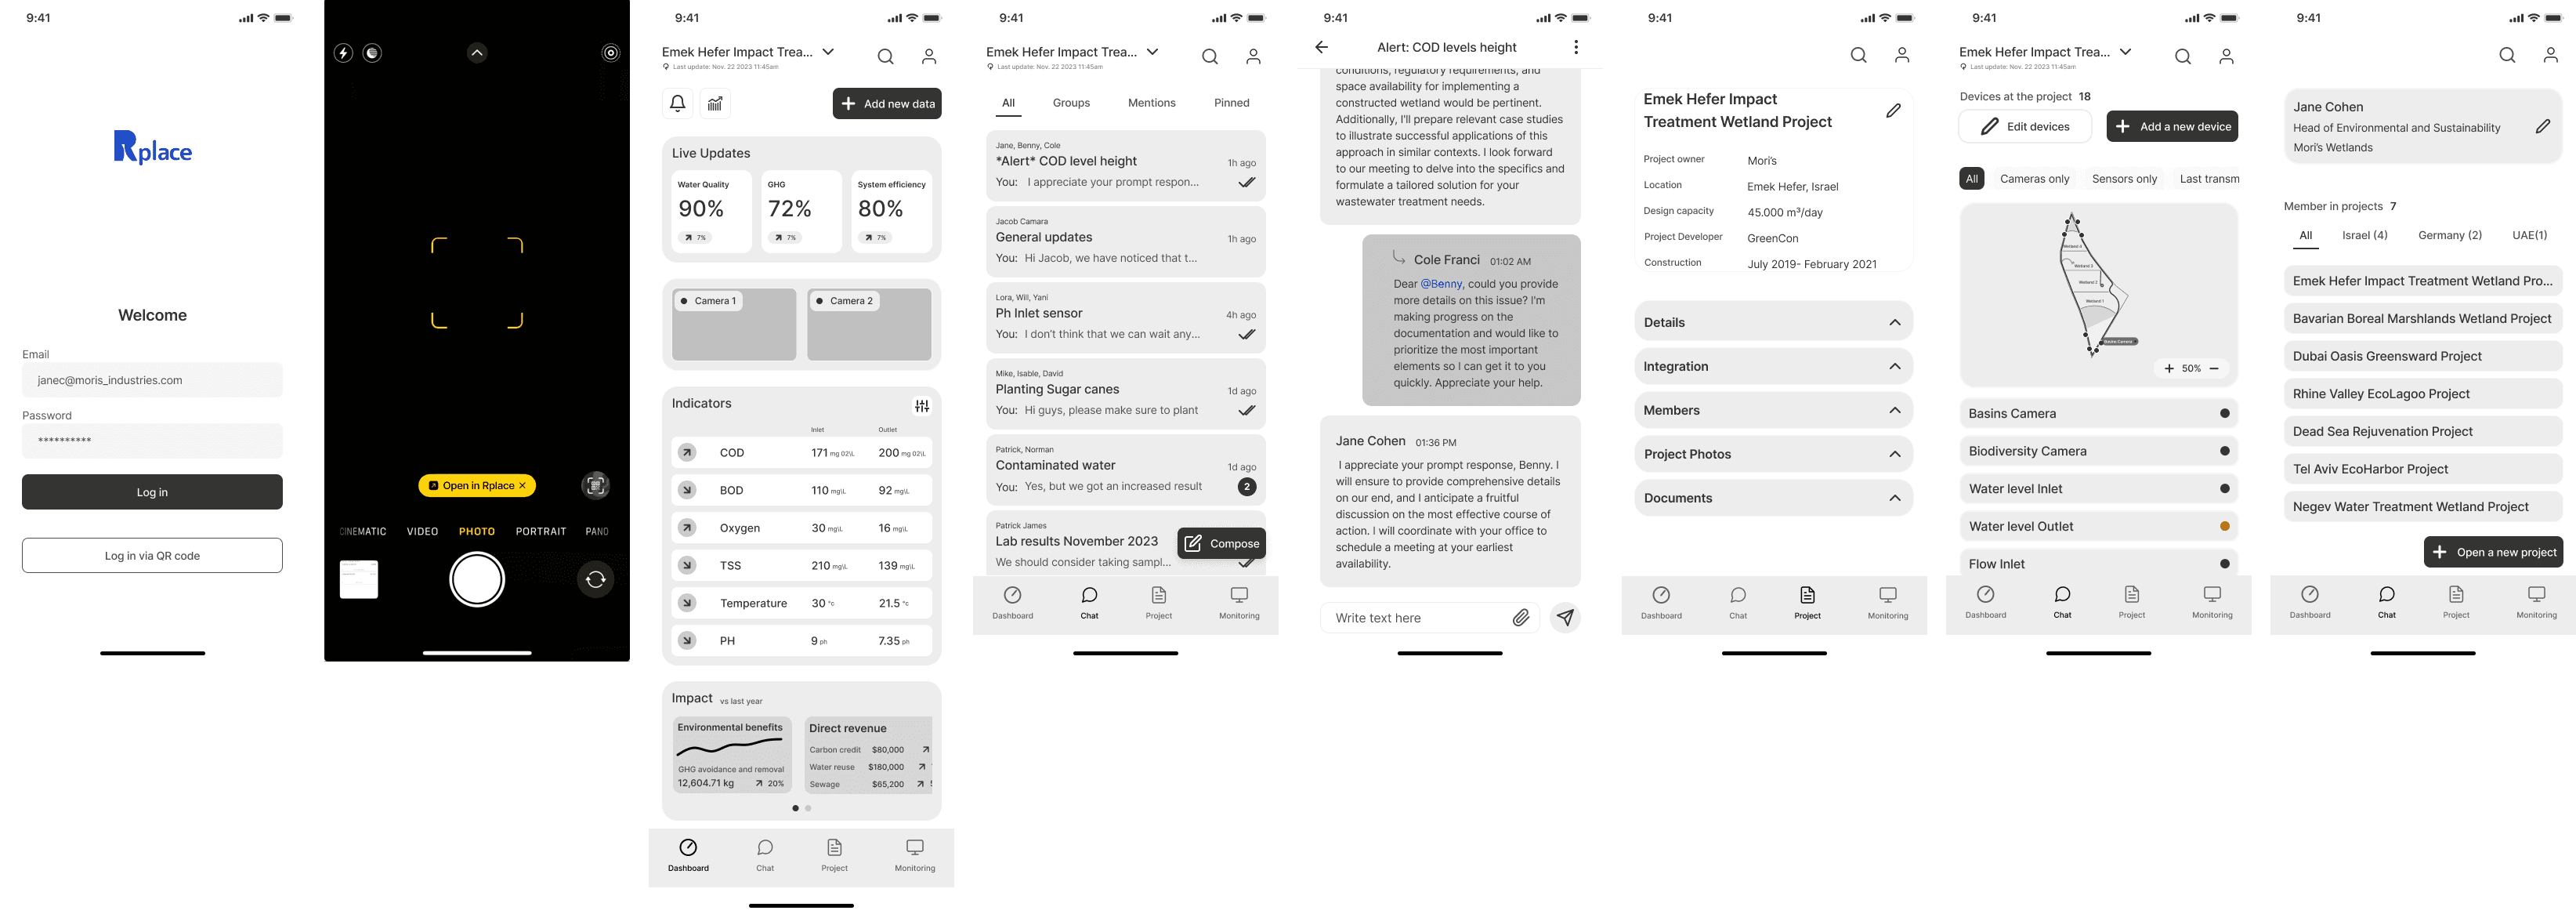
Serving as the core of the platform, the dashboard underwent meticulous design.
To comprehend the composition of features presented on this screen, I built a table containing a list of features with detailed explanations of what needs to be shown.
Serving as the core of the platform, the dashboard underwent meticulous design.
To comprehend the composition of features presented on this screen, I built a table containing a list of features with detailed explanations of what needs to be shown.

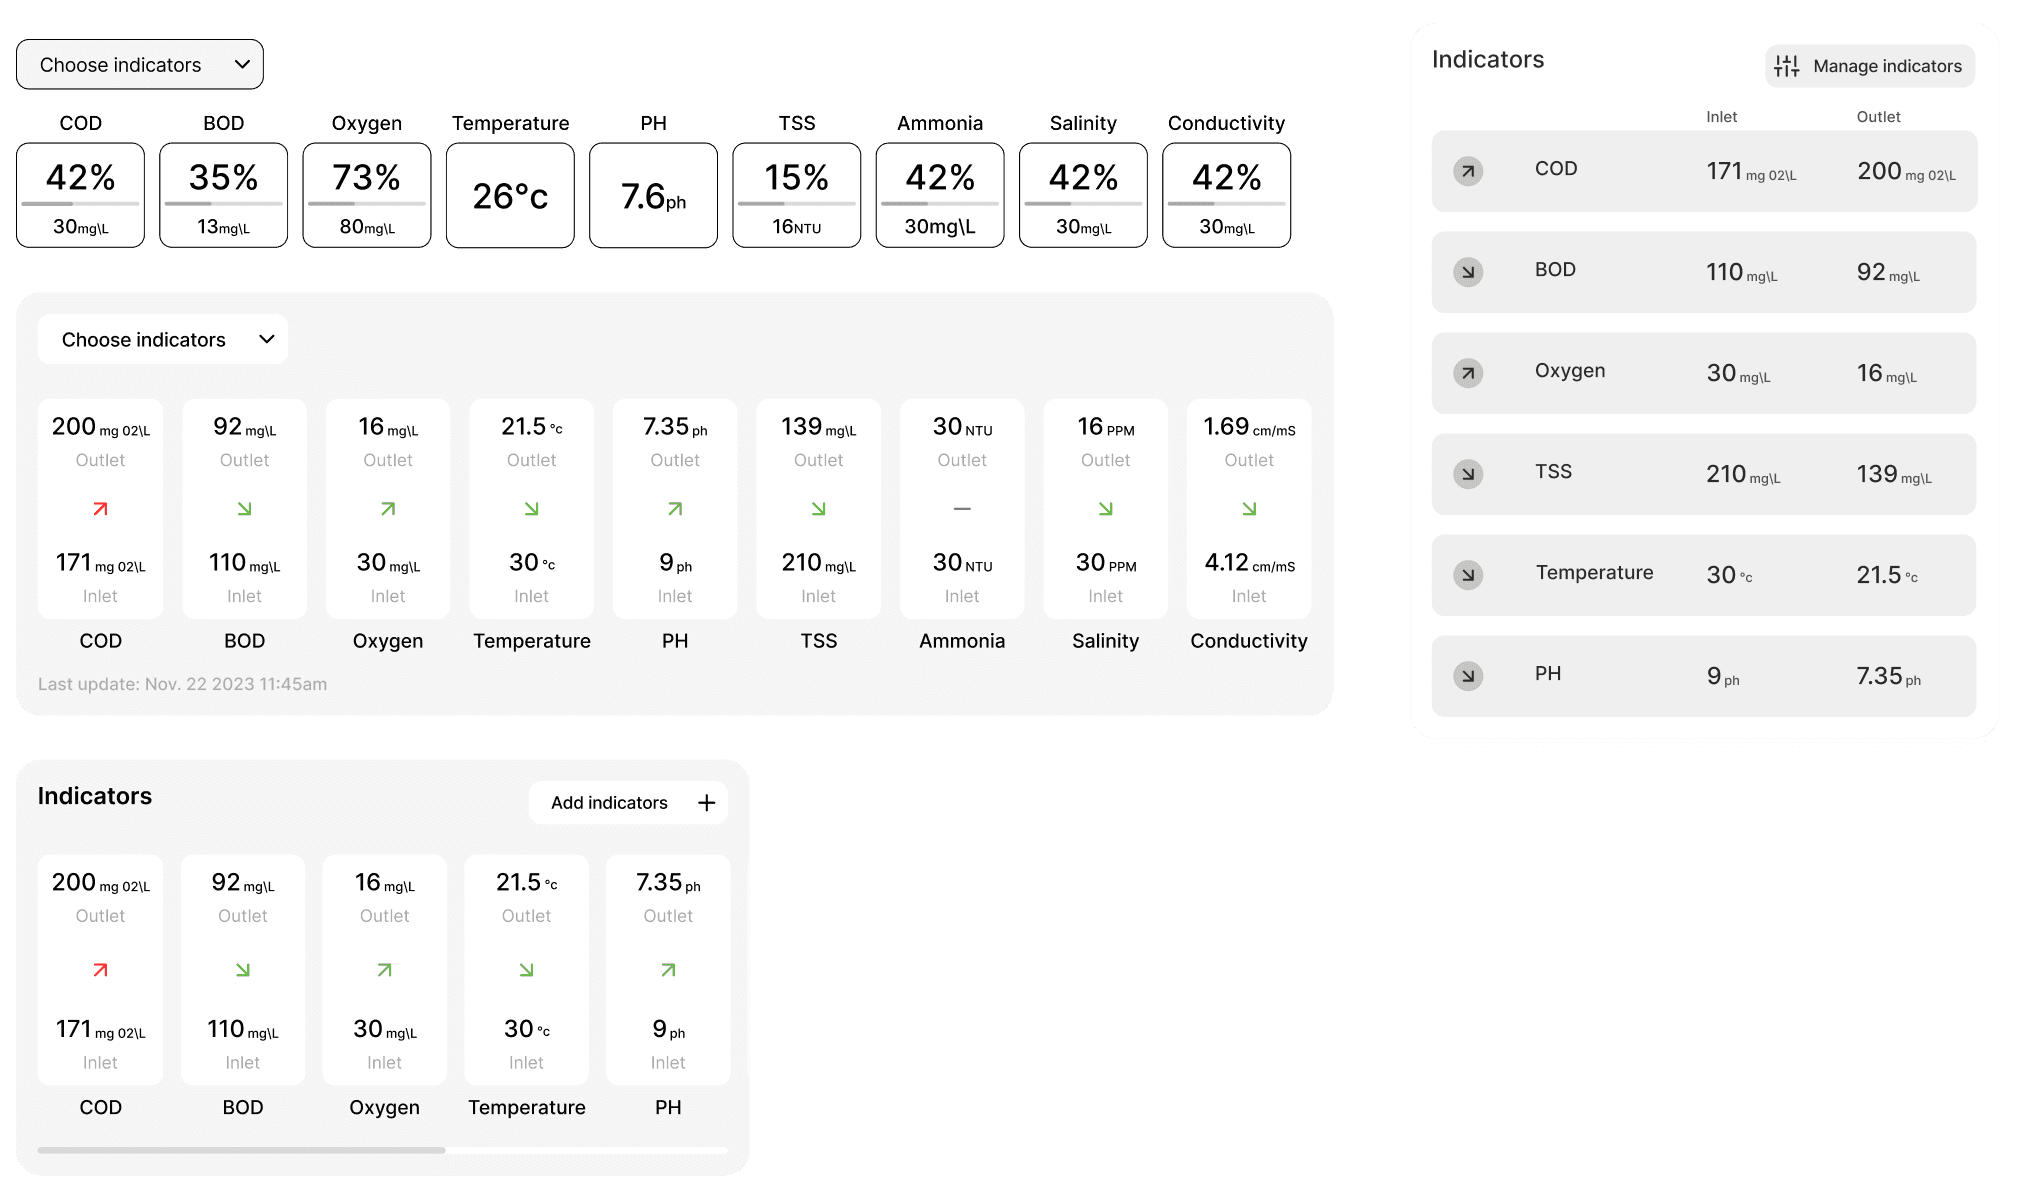
This process was helpful due to the amount of information displayed on the dashboard screen. I explored a few versions of hierarchy and presented them to the stakeholders, which helped me refine the design.
A significant challenge I encountered during the process was the design and placement of the indicators—a crucial yet complex feature. To simplify the user experience, I added a colored arrow that expresses the positive and negative trends that have occurred recently. The dashboard is a live screen, as are the indicators. This is reflected in the indicator trends, which is why I made them clickable. With just one click, the user can see the weekly graph and the daily table. This solution helps users understand the trends more effectively.
This process was helpful due to the amount of information displayed on the dashboard screen.
I explored a few versions of hierarchy and presented them to the stakeholders, which helped me refine the design.
A significant challenge I encountered during the process was the design and placement of the indicators—a crucial yet complex feature. To simplify the user experience, I added a colored arrow that expresses the positive and negative trends that have occurred recently. The dashboard is a live screen, as are the indicators. This is reflected in the indicator trends, which is why I made them clickable. With just one click, the user can see the weekly graph and the daily table. This solution helps users understand the trends more effectively.
Iterations
Why I choose this version
After several iterations, which included discussions with stakeholders and exploration of various hierarchy options, I arrived at the final solution. This version seamlessly presents different media and information in a balanced manner, guiding the user's eye to efficiently consume and collect essential data.
After several iterations, which included discussions with stakeholders and exploration of various hierarchy options, I arrived at the final solution. This version seamlessly presents different media and information in a balanced manner, guiding the user's eye to efficiently consume and collect essential data.
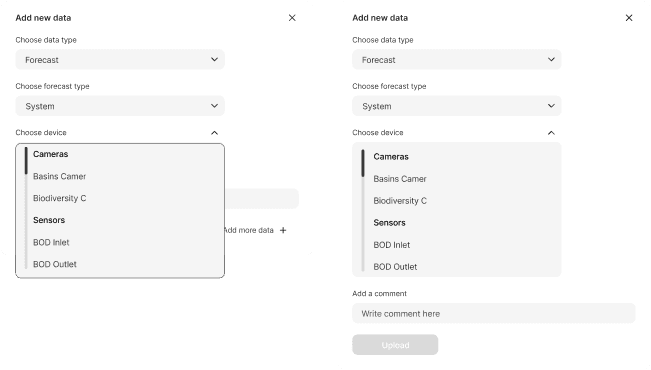
Add New Data
Add New Data
As the work progressed and conversations with stakeholders deepened, I realized I had overlooked a crucial flow: "Add new data." To construct this flow, I revisited user activities, considering the frequency of data updating. This process generated a list of actions to be incorporated into the new flow, and I defined a set of components to accommodate all data insertion processes.
As the work progressed and conversations with stakeholders deepened, I realized I had overlooked a crucial flow: "Add new data." To construct this flow, I revisited user activities, considering the frequency of data updating. This process generated a list of actions to be incorporated into the new flow, and I defined a set of components to accommodate all data insertion processes.
I have learned that this feature must contain these elements-
I have learned that this feature must contain these elements-
Add comment section, with the ability to tag relevant stakeholders.
Continues adding of several different data.
Status of care.
Tag of device for easy access.
Add comment section, with the ability to tag relevant stakeholders.
Continues adding of several different data.
Status of care.
Tag of device for easy access.
Also, I have learned that it needs to be an on-the-go feature. That means it should be quick and easy, requiring a minimal number of clicks. I came to the conclusion that it should be a pop-up feature on top of the dashboard.
Due to a short time limit, there were almost no iterations. I examined a few options for the user experience in a quick process and chose the version that presents the needed information in the simplest and easiest way.
Why I choose this version
The final design consists of a group of pop-up screens that adapts to the users' needs based on the type of data.
It uses common elements that helps the user understand tasks that needs to be done easily and quickly.
The final design consists of a group of pop-up screens that adapts to the users' needs based on the type of data.
It uses common elements that helps the user understand tasks that needs to be done easily and quickly.

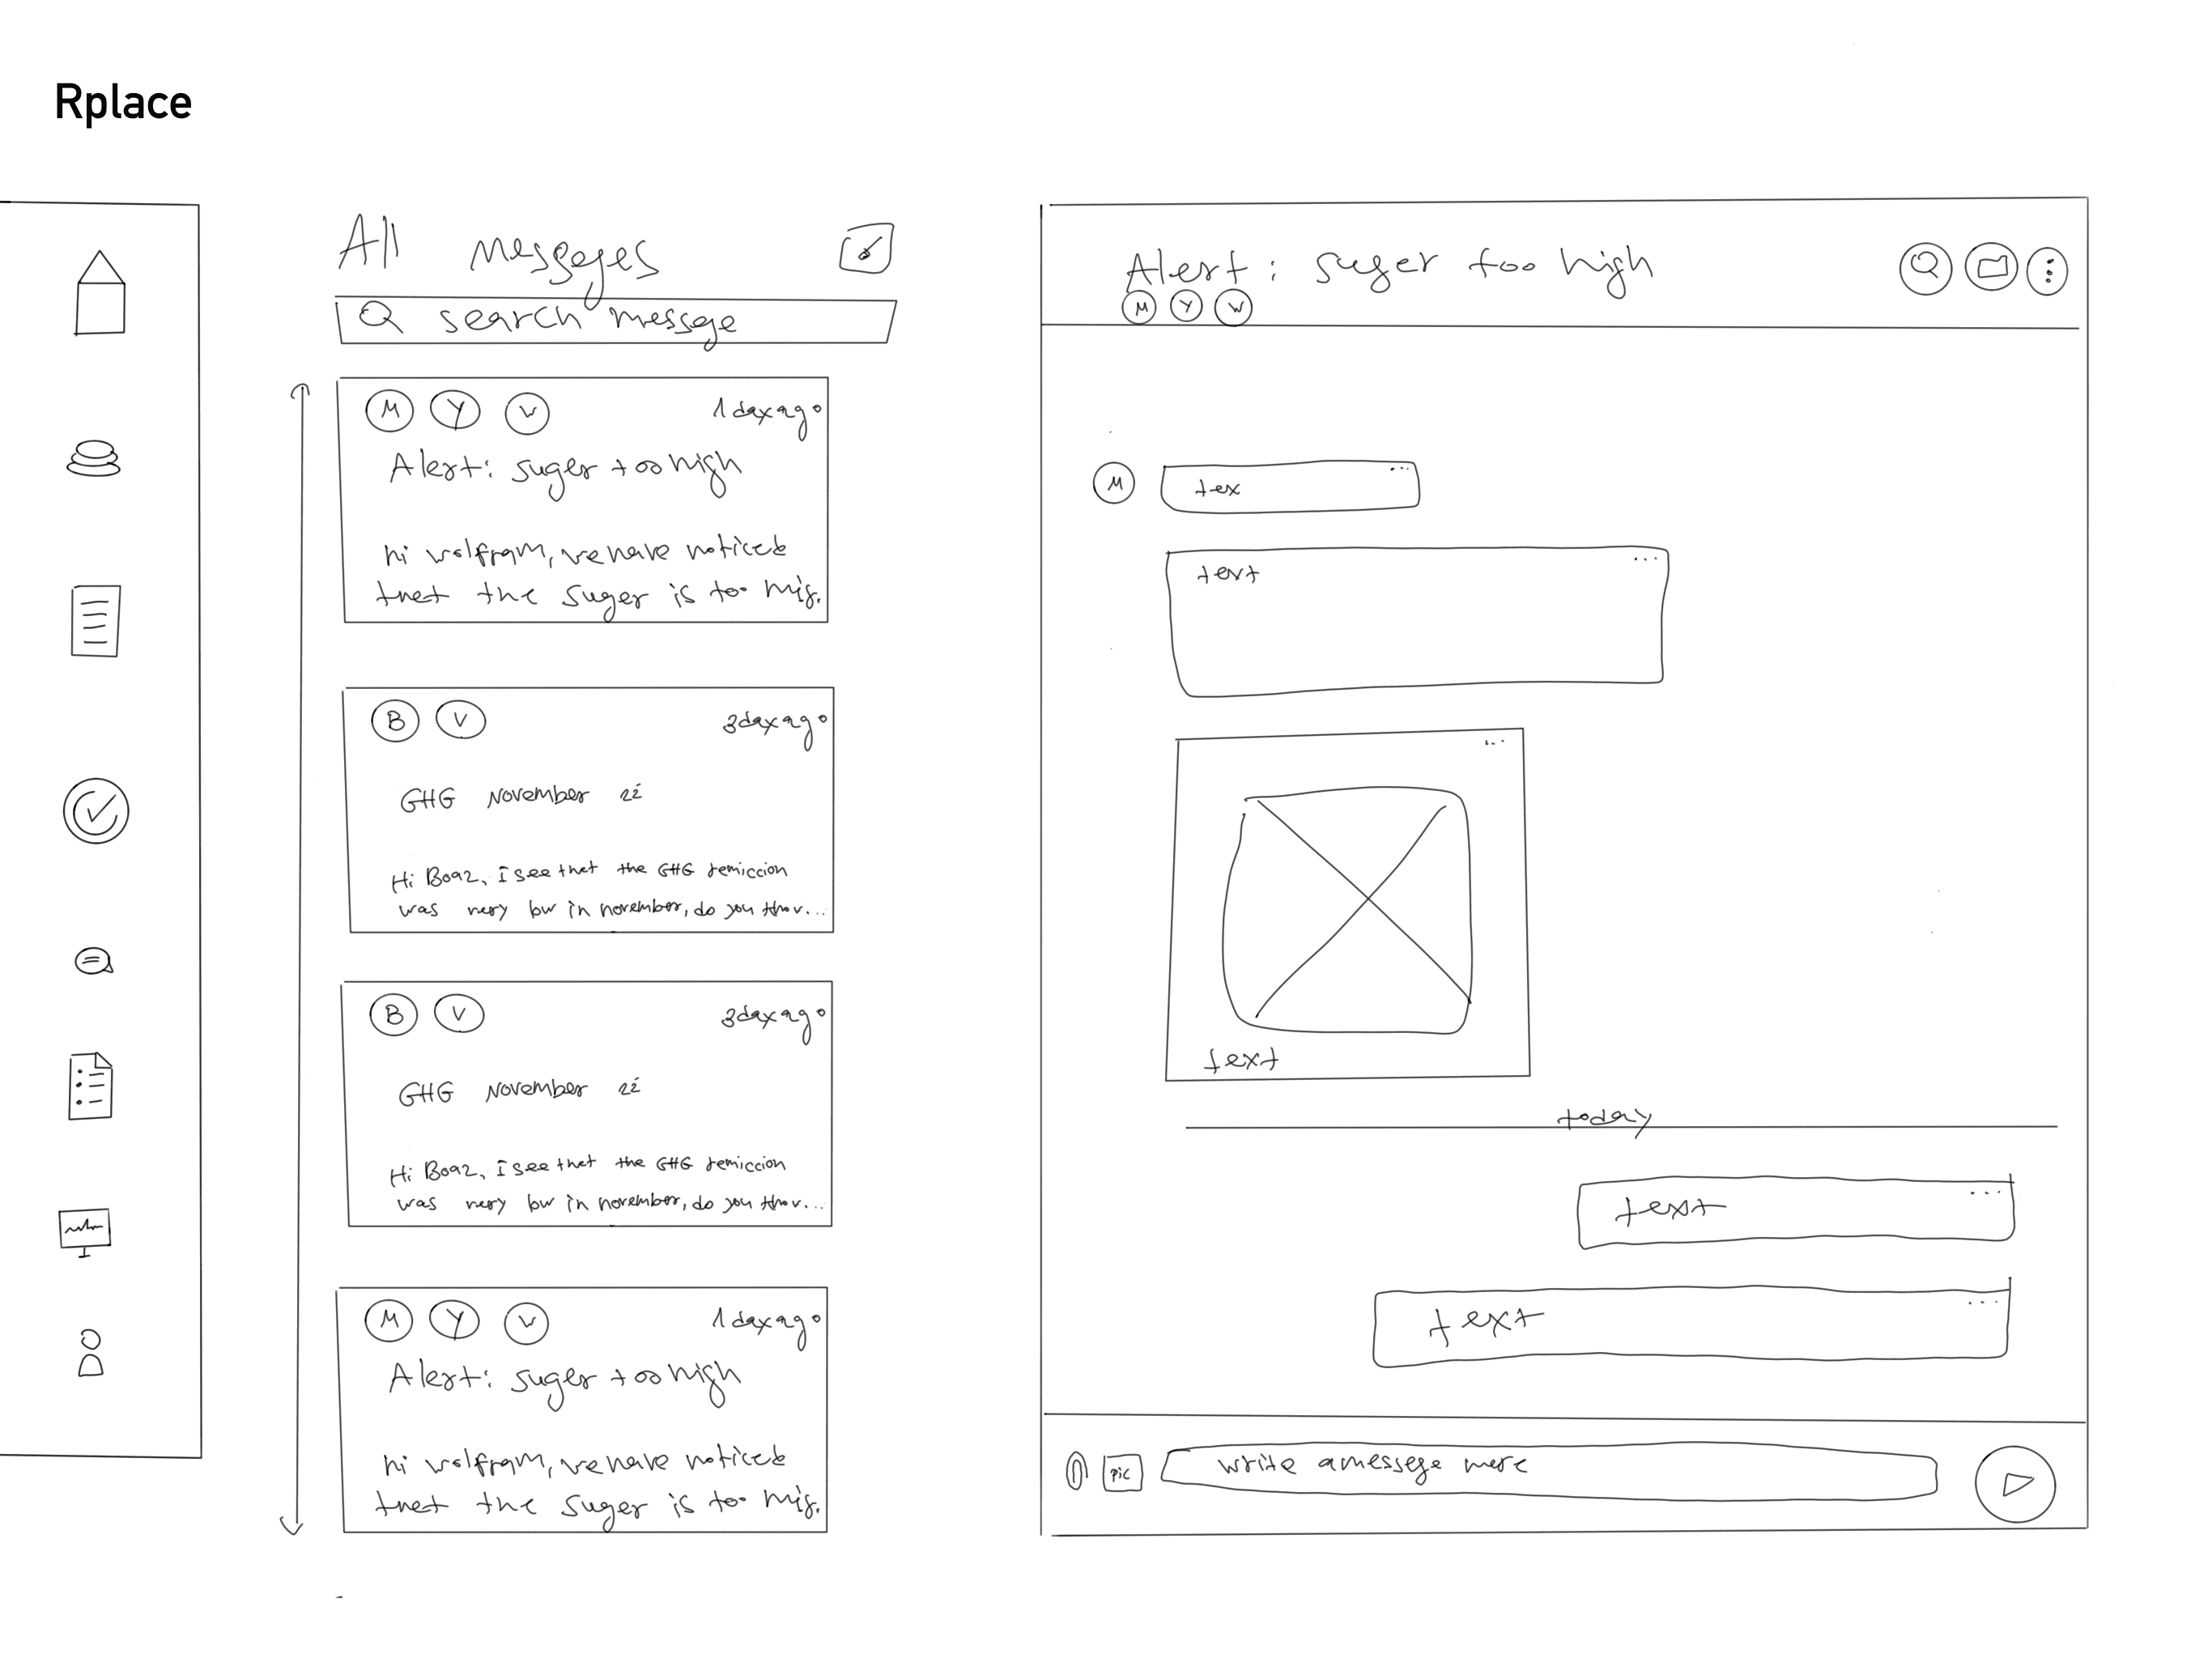
Mobile App Wireframes
Mobile App Wireframes
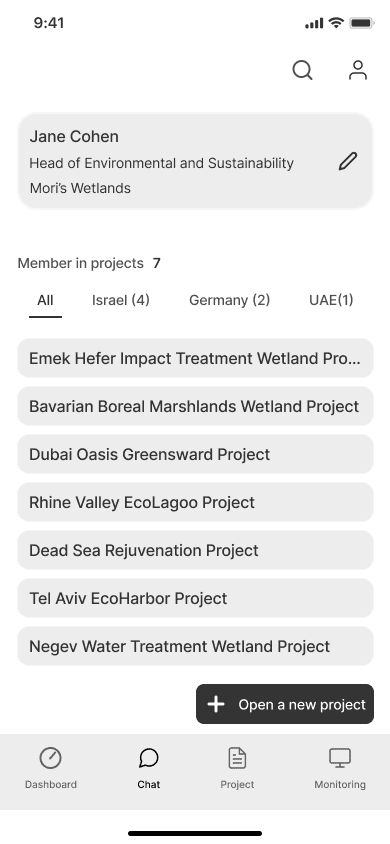
After designing the Rplace web application, I transitioned to the mobile app.
Taking insights from interviews into account, I concentrated on crucial aspects of remote facility management. Adapting to the distinct usage between web and mobile, I streamlined features for better remote system oversight, resulting in the removal of unnecessary elements and enhancing user experience.


Visual design
Visual design
Infusing Brand Identity into the Platform
Infusing Brand Identity into the Platform
Colors
Colors
Rplace's focus on water solutions inspired the platform's primary color—vibrant yet mild blue, reflecting loyalty and reliability. The original logo adapted seamlessly to maintain brand recognition.
Rplace's focus on water solutions inspired the platform's primary color—vibrant yet mild blue, reflecting loyalty and reliability. The original logo adapted seamlessly to maintain brand recognition.
Typography
Typography
Inter
Aa
Regular
Abcdefghijklmnopqrstuvwxyz
SemiBold
Abcdefghijklmnopqrstuvwxyz
Bold
Abcdefghijklmnopqrstuvwxyz
Source Sans Pro
0123456789
Takeaways
Takeaways
Nurturing a Platform for the Future
Nurturing a Platform for the Future
After detailing the MRV user experience across onboarding, the dashboard, reports, and other screens, the next project phase involves further research, design, and platform release for user engagement. With ongoing refinement, the platform has the potential to be a financial benefit for users.
After detailing the MRV user experience across onboarding, the dashboard, reports, and other screens, the next project phase involves further research, design, and platform release for user engagement. With ongoing refinement, the platform has the potential to be a financial benefit for users.
Future Steps and Insights
Future Steps and Insights
Reflecting on my experience, I dedicated significant time to research and collaboration with stakeholders, understanding user needs, and refining the system. Working with stakeholders posed challenges due to their familiarity with non-technological methods, providing me with valuable learning experiences. It required a deep dive into research, enhancing my ability to convert non-tech processes into user-friendly technological solutions, while ensuring ease of understanding.
Reflecting on my experience, I dedicated significant time to research and collaboration with stakeholders, understanding user needs, and refining the system. Working with stakeholders posed challenges due to their familiarity with non-technological methods, providing me with valuable learning experiences. It required a deep dive into research, enhancing my ability to convert non-tech processes into user-friendly technological solutions, while ensuring ease of understanding.
Let's Embark on a
New Adventure Together
0525458804
Let's Embark on a
New Adventure Together
0525458804